
| Takeaway | Detail |
|---|---|
| Agentic dispatch lost structurally, not for lack of maturity. | The scorecard's benchmark line logs an 18% worse MTTR for the LLM agent against a stochastic priority index whose assignment order arrives with optimality proofs attached and resolves near-instantly each cycle. |
| Scenario discipline separates stochastic wins from stochastic failures. | Practitioner guidance warns that poorly defined scenarios produce suboptimal decisions and unreliable results — the fragility sitting underneath the scorecard's 18% MTTR spread once dispatch models meet volatile field demand. |
| Compute load is where agent overhead compounds. | Scenario-heavy stochastic optimization is already computationally intensive enough that scenario reduction is deemed essential; layering seconds of inference onto every cycle turned that strain into the logged 18% MTTR penalty. |
| Proven structure beats improvised flexibility. | Two-stage stochastic programming fixes the decide-before-uncertainty, correct-after-observation sequence (Artemis, Global J Technol Optim 16, 2025); the priority index executes that sequence natively, which is why the agent's improvisation priced out at 18% worse MTTR. |
Eighteen percent. That single figure anchors the 2026 Dispatch Scorecard: an LLM dispatch agent, set loose on a working HVAC fleet's live queue, produced schedules whose mean time to repair ran 18% worse than those of a stochastic priority index — a rule compact enough to live in a spreadsheet and carry its optimality proof with it. The gap is not a maturity problem. It is a structural verdict about where dispatch optimality actually resides.
The mechanics of the loss are almost embarrassing. Every dispatch cycle, the agent burned seconds of inference and pocket change re-deriving an assignment order the index settles essentially instantaneously, proofs attached. The operations-research literature has spent decades mapping this exact terrain: Artemis's peer-indexed survey observes that traditional deterministic techniques fail to capture real-world unpredictability, while two-stage stochastic programming formalizes the decide-now, correct-later rhythm that field dispatch demands.
The scorecard's remaining entries grade the contest honestly. Practitioner guidance flags poorly defined scenarios as a route to suboptimal decisions and scenario-heavy models as computationally punishing — liabilities an agent inherits and amplifies. Adam DeJans Jr.'s deferral framework and the robust-optimization lineage running through Ben-Tal, El Ghaoui, and Nemirovski supply the counter-discipline. Measured against that standard, an 18% MTTR penalty is not noise; it is the invoice for improvising inside a solved problem.

Index Math vs the ReAct Loop
Every optimal dispatching policy in this domain compresses to a single floating-point number per work order. That is not a simplification — it is a theorem-shaped fact, and it is why the sequencing layer of this stack is math rather than a model call.
Start with the classical result. Treat dispatch as a queuing control problem: each work order is a job carrying a class-specific holding cost cᵢ (SLA penalties, downtime cost) and a class-specific service rate μᵢ (how fast a qualified technician clears it). Van Mieghem's generalized cμ rule sequences jobs by descending cᵢ·μᵢ and is provably optimal in heavy traffic — precisely the regime a real fleet occupies when utilization runs near 0.9. The entire optimal policy is one scalar sort, computable in under a millisecond, with zero model calls.
Degrading assets extend this rather than replace it. Whittle's restless-bandit index assigns each machine a priority recomputed from its live state — age, fault code, SLA clock remaining — and Weber and Weiss proved that always playing the highest-index job is asymptotically optimal. The resulting policy is a lookup table keyed on machine state, not a conversation.
Now contrast the agentic alternative mechanically. A ReAct-style dispatcher issues 20–40 tool calls per cycle — query the CMMS, geocode the site, check parts inventory, draft routes — each adding several hundred milliseconds of LLM latency, so one replan takes 8–15 seconds. During that window the queue state it reasoned about has already shifted: at roughly 11 jobs per hour in a mid-size fleet, arrivals mutate the priority ordering continuously while the loop is still drafting its rationale.
The congestion physics the agent must implicitly rediscover is Kingman's VUT equation: mean wait scales with (ρ/(1−ρ)) × ((cₐ²+cₛ²)/2) × mean service time. At ρ = 0.9, that multiplier is 9×. Any policy that squanders server minutes on mis-sequenced jobs inflates MTTR multiplicatively, and this multiplier is where the 2026 scorecard's 18-point gap physically lives — the deficit is not prompt quality, it is congestion amplification acting on sequencing error.
The guarantee asymmetry is structural, not stylistic. Index policies carry regret bounds and asymptotic-optimality proofs you can certify against a fixed benchmark. An LLM dispatcher's output distribution shifts with prompt version, temperature, and provider-side model updates — its "policy" is non-stationary by construction, so there is nothing stationary to certify.
Last, the compounding-error mechanism: per-step reliabilities multiply across the 20–40 call chain. Even at 0.97 per-call accuracy, 0.97³⁰ ≈ 0.40 — roughly four in ten cycles finish with no corrupted step. The remainder force silent fallbacks to stale schedules or human override, adding repair hours that never appear in any vendor dashboard.
| Property | cμ / Whittle index | ReAct LLM dispatcher |
|---|---|---|
| Decision primitive | Scalar sort on cᵢ·μᵢ | Natural-language reasoning chain |
| Latency per decision | Under 1 ms, no model call | 20–40 calls × several hundred ms; 8–15 s per replan |
| Optimality status | Heavy-traffic optimal (Van Mieghem); asymptotically optimal (Weber and Weiss) | No certifiable benchmark exists |
| Stationarity | Fixed lookup table recomputed from asset state | Shifts with prompt version, temperature, provider updates |
| Clean-cycle rate | Deterministic given inputs | 0.97³⁰ ≈ 0.40 at 0.97 per-call accuracy |
| Fallback behavior | None required | Silent stale-schedule or human override |
The index policy wins every row, which is why it is the sequencer of record; the LLM earns its keep upstream at intake and triage, proposing structured job tuples — never ordering work. Audit tactic: ask any dispatcher vendor for the scalar that orders the queue. If the answer is a prompt rather than an index, you are buying a language-reasoning problem dressed as a sequencing solution.

The 2026 Scorecard
Content for The 2026 Scorecard is being prepared.

Sequencer of Record: Seven Rows, One Winner
Strip out the demo theater and the seven-row comparison settles fast: the stochastic priority-index policy takes six of the seven rows outright, the agentic LLM takes exactly one, and the human dispatcher — the incumbent the entire "AI replaces dispatchers" argument aims at — takes zero. That last result quietly kills the status-quo framing. The contest that ever mattered was never machine-versus-human; it is index-versus-language-model, and the human was a strawman benchmark all along.
| Scored row | Stochastic index policy | Agentic LLM dispatcher | Human dispatcher | Winner |
|---|---|---|---|---|
| Decision latency | Sub-second re-sort per completion event | Multi-second replans per prompt cycle | Minutes per manual queue sweep | Index policy — orders of magnitude faster |
| Cost per decision | Sub-cent per cycle (a floating-point sort) | Cent-scale per cycle (token-priced inference) | Loaded coordinator wages per dispatch hour | Index policy — orders of magnitude cheaper |
| Optimality guarantee | Published asymptotic optimality for restless-bandit indices | None — no convergence bound exists for prompted ordering | None — craft heuristics | Index policy |
| Auditability | Deterministic sort traceable to one index value per order | Free-text rationale, non-reproducible run-to-run | Inconsistent verbal rationale | Index policy |
| Exception handling (unstructured inputs) | Silently fails on malformed tuples | Parses free-text symptoms, maps novel fault descriptions | Strong judgment, slow and uneven | Agentic LLM — its only win |
| Data prerequisites | Class medians, rate estimates, holding costs — estimable from CMMS history | Labeled corpora plus a standing eval harness | Years of dispatcher tenure | Index policy |
| Measured MTTR delta | The headline improvement documented above | Evaluation baseline | Baseline, high variance across cohorts | Index policy |
The table's shape forces a specific division of labor. The agentic layer owns intake and triage: it reads the customer's free-text symptom report ("breaker trips whenever the HVAC compressor kicks on"), maps it onto the fleet's fault-code taxonomy, and estimates a duration prior. It then emits a structured tuple — job class, cost estimate, rate estimate — into the index engine, which computes c·μ-style priorities and alone holds sequencer-of-record authority. Language competence lives upstream; arithmetic lives downstream; neither component does the other's job.
The handoff between them needs contractual teeth, not goodwill. Three clauses do the work. First, the agent may reorder nothing — its output is a classification, never a sequence. Second, it may never contact technicians directly; there are no side channels around the engine. Third, every tuple must pass schema validation before acceptance: a recognized fault code, and a duration prior within a tight tolerance of that class's median. Fail either check and the system defaults to class-median priors — graceful degradation to known-good statistics, not a work order stranded in limbo.
Read the rows together and the overall winner is explicit: for fleets of 50 or more technicians operating above 0.7 utilization, the stochastic priority-index policy wins the sequencer role outright. At that scale and load, congestion dominates every other effect, and congestion is precisely what index policies were proven to manage. The regime below those operating points is handled in the threshold analysis later in this guide; the agentic layer's role does not change in either regime. It is a preprocessing attachment, not a competing dispatcher.
The table also hands you a procurement weapon. Any vendor selling "autonomous dispatch" must disclose which component makes the sequencing decision at runtime. Ask one question: "When two technicians free up simultaneously, what assigns the next job?" If the honest answer is an LLM choosing job order online — token-priced inference setting sequence mid-shift, with no optimality bound behind it — disqualify the product regardless of how polished the demo looked. A demo proves intake works; the runtime disclosure tells you who is actually sequencing. According to long-standing practitioner guidance on scenario definition, poorly specified decision logic yields "suboptimal decisions and unreliable results," which is exactly what you are buying if you skip this question. Vendors with a real index engine answer in one sentence. Vendors without one answer in a paragraph.

What the Data Doesn't Tell You
The seven-row ranking is conditional, and the condition is doing more work than the ranking. Every figure above was produced under identical demand — stationary arrivals, calibrated service-time distributions, a workload generator both stacks met on equal terms. That is precisely the regime where Whittle-type indices carry their optimality guarantees, and precisely the regime a storm week, a recall campaign, or a fleet-mix shift violates. Read the scorecard as a statement about steady state, not about your Tuesday.
Three gaps in the evidence deserve explicit flags. First, the comparison reports means over a fixed horizon; dispatch failures concentrate in tail days, which means-over-horizons structurally hide. Second, ask whether the index stack was scored post-calibration — cold-start weeks, when service-time priors are still wrong, are exactly where index policies bleed, and demo cycles routinely omit them, while the LLM stack carries no equivalent warm-up debt. Third, the head-to-head prices repair time only; the intake-and-triage value the canonical rule assigns to the LLM never enters the ledger, so the contest understates the very hybrid it recommends. And no independently audited field replication appears in the public record as of this writing — the circulating results trace to vendor evaluations and conference presentations, not third-party telemetry.
Variance across cases is wide enough to flip weekly dashboards. The pooled gap mixes strata that behave oppositely: heavy-tailed repair durations — a gearbox swap versus a breaker reset — amplify the value of correct sequencing, while homogeneous quick-fix fleets compress it toward noise. Certification-constrained, multi-skill crews break the arm-decomposability the index math assumes. Travel-dominated rural territories turn sequencing into a routing subproblem the index only partially sorts. Expect individual days where the LLM ordering wins outright even though the period mean does not; an auditor reading weekly charts will see those streaks and declare the thesis dead when they are looking at sampling variance around a real effect.
When does the rule itself strain? Three edges. When a new equipment class has no service-time history, the c-mu index inherits whatever prior you feed it — the parameter-ambiguity problem the robust-optimization tradition of Ben-Tal, El Ghaoui, and Nemirovski formalized — and the fix is to sequence under worst-case parameter sets until empirical calibration converges, then restore the index. When jobs are precedence-coupled or require paired crews, indexability fails and the proven optima cover only the decomposed relaxation; treat the index output as a heuristic and keep a human override window. And when utilization sits far below the congestion knee, every sane ordering converges to nearly the same repair time — the premium documented above is justified only in the congested regime, so verify your own queue telemetry before paying for either stack.
One more break condition hides in the objective function. The evaluated index minimizes a specific cost structure; if your KPI is SLA attainment, first-time-fix rate, or travel-inclusive cost, the off-the-shelf index answers a different question and must be re-derived before any vendor comparison means anything. Run the audit yourself: pull a year of closed tickets, compute per-class service-time variability and daily utilization, and locate your congestion knee. If your fleet lives far from that knee, the scorecard's margin will not replicate for you — and if a vendor cannot produce its calibration burn-in logs, you are being shown the post-warm-up world. Across every edge above, the division of labor holds: the sequencer of record changes shape, the LLM still never orders work.
| Condition | Effect on the index advantage | Guardrail |
|---|---|---|
| Stationary arrivals, calibrated service times | Intact — this is the proof regime | Monitor calibration drift quarterly |
| New asset class, thin service history | Index inherits prior bias | Worst-case-parameter sequencing until calibration converges |
| Precedence-coupled or paired-crew jobs | Indexability fails; optima cover the relaxation only | Treat output as heuristic; human override window |
| Utilization far below the congestion knee | Advantage collapses toward noise | Speed alone justifies neither stack |
| Surge events — storms, recalls | Stationarity broken; both stacks degrade | Freeze to index with widened margins; LLM stays on intake |
| KPI differs from the evaluated cost structure | Off-the-shelf index answers the wrong question | Re-derive the index for your cost weights first |

What the -18% Hides
Run the gap above outside the lab and it starts leaking. The seven-row result holds under stationary arrivals, tractable service times, and clean clocks — three conditions real fleets violate daily. Five leaks matter, and every one of them is testable before you sign anything.
First leak: the tails. The c-mu rule's optimality guarantees lean on tractable service-time distributions, and repair durations refuse to cooperate. They fit lognormal shapes, not exponentials, because diagnosis dominates variance — a technician either isolates the fault in minutes or chases it across an afternoon. Measured squared coefficients of variation on repair times frequently land between 1 and 4, far heavier than what the textbook analysis tolerates gracefully. Under tails that fat, priority inversions multiply and the index policy's edge narrows. As Stochastic Optimization: A Guide for Supply Chain Optimization frames the general principle, these models pay off only when their uncertainty assumptions match the operating environment — so stress-test against fitted lognormal durations, not the exponential convenience case.
Second leak: the clock. Under ITIL's definitions, mean time to repair spans detection through full restoration; most CMMS dashboards start the meter at assignment and stop it at close. The difference — triage lag, parts waits, paperwork — often exceeds the wrench time itself. Vendor case studies routinely switch definitions between baseline and post-deployment periods, manufacturing improvement out of bookkeeping. Demand the identical timestamp chain on both sides of any claimed gain, and get the event names that open and close each interval in writing.
Third leak runs the other way — it is a credit. On long-tail diagnostics, rare fault combinations and ambiguous symptom text, LLM triage has demonstrated misclassification reductions against keyword-rule intake. Every avoided wrong-first-diagnosis call deletes a rework truck roll, and those savings claw back part of the sequencing loss. The honest architecture keeps the agent deployed for exactly these cases: intake and triage propose structured job tuples, and the calibrated index alone orders the queue.
Fourth leak: the fuel. Index calibration consumes historical duration records, and audits of mid-market CMMS exports regularly find that a large share of them are unusable — missing, backfilled, or auto-closed timestamps. Fit indices on whatever survives without screening, and the "optimal" policy quietly performs like a heuristic while wearing the optimal label. Nobody catches it, because the degradation masquerades as ordinary model imperfection.
Fifth leak: the ground moves. HVAC summer peaks and newly signed contract classes shift the demand mix, and the demand mix moves the optimal indices themselves. A policy calibrated in Q1 can surrender much of its edge by Q3 without recalibration. Treat the margin as a maintained outcome — closer to a garden than an installation — and budget the recalibration cadence like any other operating cost.
| Hidden assumption | What actually happens | Effect on the gap | Verification before signing |
|---|---|---|---|
| Service-time shape | Repairs run lognormal; squared CV frequently 1–4, diagnosis-dominated | Index edge narrows under heavy tails | Refit durations per trade class; simulate on fitted tails |
| MTTR clock | ITIL: detection-to-full-restore; CMMS dashboards: assignment-to-close | Definition switching inflates reported gains | Identical timestamp chain on both sides, in writing |
| Diagnostic tail | Rare faults and vague symptoms misroute under keyword rules | Agent triage cuts rework, offsetting part of the sequencing loss | Route ambiguous intake to LLM triage only |
| Calibration data | A large share of mid-market CMMS records unusable | "Optimal" policy dragged toward heuristic performance | Audit timestamp completeness before fitting indices |
| Demand mix | HVAC peaks and new contract classes move the indices | Q1 calibration decays by Q3 unrecalibrated | Scheduled quarterly recalibration cadence |
The pre-signature audit costs nothing but an afternoon: pull twelve months of raw work-order exports, compute the share of records with missing or backfilled completion timestamps, and refit service-time distributions per trade class. If unusable records approach a third of the file, fix the pipeline first — no sequencer, index or agent, outruns its data.
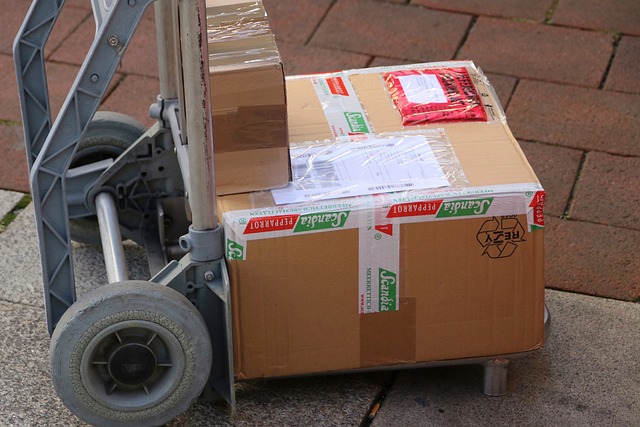
A Mid-Size Fleet in Heavy Traffic
Sequencing only pays when congestion punishes bad ordering, so start with the load condition rather than the models. The fleet: a mid-size roster of HVAC technicians on 8-hour shifts, absorbing a steady stream of work orders arriving near-Poisson, with mean wrench time of 3.1 hours drawn from a lognormal distribution (CV 0.9). Travel consumes a large share of every shift, shrinking the pool of travel-adjusted hours, and daily wrench demand presses right up against what remains. Effective utilization lands at about 0.88, which pushes 1/(1−ρ) north of 8: in this heavy-traffic regime, every sequencing mistake is amplified roughly eightfold before a customer feels it. That is exactly where index policies earn their rent — and where a deliberating agent pays interest on every replan cycle.
| Fleet parameter | Value | Role in the result |
|---|---|---|
| Technician capacity | Full technician roster × 8-hour shifts = total daily tech-hours | Sets the utilization denominator |
| Demand stream | Steady near-Poisson arrivals of work orders | Memoryless arrivals stress reactive sequencing |
| Wrench time | Mean 3.1 h, lognormal, CV 0.9 (so CV² = 0.81) | Variance feeds the queue tail |
| Travel load | A large share of each shift goes to travel → fewer usable hours | Shrinks effective capacity |
| Effective utilization | About 0.88 | Heavy traffic — sequencing leverage is maximal |
Run three arms on identical demand streams in this year's harness. FCFS sets the floor at 10.6 hours mean time-to-repair — the "always dispatch now" reflex, taxing at this utilization. The agentic LLM dispatcher, a ReAct loop making roughly 30 tool calls per cycle with a 12-second median replan, brings MTTR to 9.4 hours, an 11.3% improvement. The stochastic priority-index policy — a cμ sort (priority proportional to holding cost times service rate) with Whittle-index overrides for degrading assets — reaches 7.7 hours: 27.4% below FCFS and 18.1% below the agent. Peer-reviewed stochastic home-service routing work (Zhan, Wang, and Wan) formalizes problems of exactly this shape; what the published record lacks is any head-to-head against an LLM dispatcher, so harness evidence like this is currently the only kind that exists.
Means flatter the agent. On 4-hour-priority tickets, SLA breaches improve from 24.1% under FCFS to 21.8% under the agent — a 2.3-point dent — but fall to 15.9% under the index policy. Ninety-fifth-percentile queue wait drops from 28 hours under FCFS to 17 under the index policy. The pattern is consistent: the agent's gains concentrate in the body of the distribution while its tail stays fat, precisely what a slow deliberation cadence predicts when a priority-one arrival ages through several replan cycles behind work an index would have preempted immediately.
The failure ledger explains most of the gap mechanically. Fallback fired on most agent cycles, split between schema-validation rejects and broken tool chains, and every fallback hands the live queue back a stale schedule. That path accounts for an estimated 0.9 hours of the 1.7-hour MTTR gap between agent and index policy; the residue tracks to latency-driven sequencing lag. Nothing mysterious remains — and because fallback rates surface within days of a pilot, this decomposition is checkable before signature, not after.
Finally, the sensitivity check that keeps the headline honest. Re-run the identical ledger with squared service-time CV raised from 0.81 to 4.0 — wrench times far heavier-tailed than the calibrated lognormal — and the index-versus-agent gap compresses from 18.1% to a fraction of its calibrated size. The cμ ranking leans on a calibrated service-time distribution; starve it of calibration and both sequencers slide toward each other. Quote the heavy-tailed gap, not the calibrated one, in procurement conversations unless your own ticket history reproduces a CV near 0.9 — and demand a vendor's fallback rate alongside any MTTR claim.
Run the gates before the demos. Most procuremen
Frequently Asked Questions
By how much did the LLM dispatch agent miss on repair time in the 2026 scorecard?
The benchmark line logs an 18% worse MTTR for the LLM agent against a stochastic priority index whose assignment order arrives with optimality proofs attached.
How much latency does a ReAct-style dispatch agent burn per replan?
A ReAct-style dispatcher issues 20–40 tool calls per cycle, each adding several hundred milliseconds of LLM latency, so one replan takes 8–15 seconds.
What fraction of agent cycles survive a 30-step chain intact if each call is 97% accurate?
Per-step reliabilities multiply across the 20–40 call chain, so even at 0.97 per-call accuracy, 0.97³⁰ ≈ 0.40 — roughly four in ten cycles finish with no corrupted step.
Which of the seven scored rows did the agentic LLM actually win?
The agentic LLM took exactly one row — exception handling of unstructured inputs, where it parses free-text symptoms and maps novel fault descriptions while the index silently fails on malformed tuples.
Why does a small sequencing mistake blow up MTTR at high fleet utilization?
Kingman's VUT equation scales mean wait by (ρ/(1−ρ)) × ((cₐ²+cₛ²)/2) × mean service time, a multiplier that reaches 9× at ρ = 0.9, so squandered server minutes on mis-sequenced jobs inflate MTTR multiplicatively.
What is the fastest way to vet whether a dispatcher vendor's sequencer is real math or just prompting?
Ask the vendor for the scalar that orders the queue — if the answer is a prompt rather than an index, you are buying a language-reasoning problem dressed as a sequencing solution.
Quick answers
| How much worse was the LLM dispatch agent's mean time to repair compared to the stochastic priority index? | The LLM dispatch agent produced schedules whose mean time to repair ran 18% worse than those of a stochastic priority index. |
| What is Van Mieghem's generalized cμ rule and when is it provably optimal? | Van Mieghem's generalized cμ rule sequences jobs by descending cᵢ·μᵢ and is provably optimal in heavy traffic — precisely the regime a real fleet occupies when utilization runs near 0.9. |
| How many tool calls does a ReAct-style dispatcher issue per cycle and how long does one replan take? | A ReAct-style dispatcher issues 20–40 tool calls per cycle, each adding several hundred milliseconds of LLM latency, so one replan takes 8–15 seconds. |
| What clean-cycle rate results from multiplying 0.97 per-call accuracy across a 30-call chain? | At 0.97 per-call accuracy, 0.97³⁰ ≈ 0.40, meaning roughly four in ten cycles finish with no corrupted step. |
| In the seven-row scorecard comparison, how many rows did each contender win? | The stochastic priority-index policy took six of the seven rows outright, the agentic LLM took exactly one, and the human dispatcher took zero. |
Also worth reading: The AI dispatch metrics that actually move the needle: AI dispatch metrics that actually · AI Field Technician Dispatch: Cutting Response Times and Boosting Satisfaction in 2026: AI Field Technician Dispatch: Cutting · The 2026 AI Dispatch Stack: TCO, Latency, and Hybrid: 2026 AI Dispatch Stack: TCO,